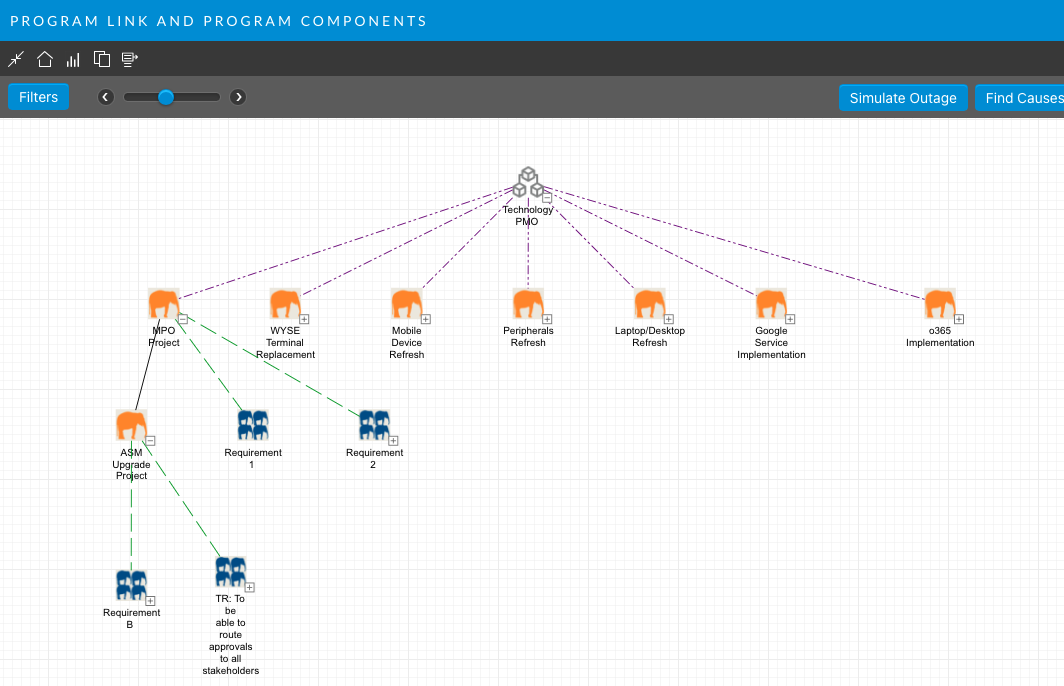
CMDB Linking Diagram
The Linking Diagram provides you with a graphical view of a specific CMDB item and the links to other CMDB items that have been defined.
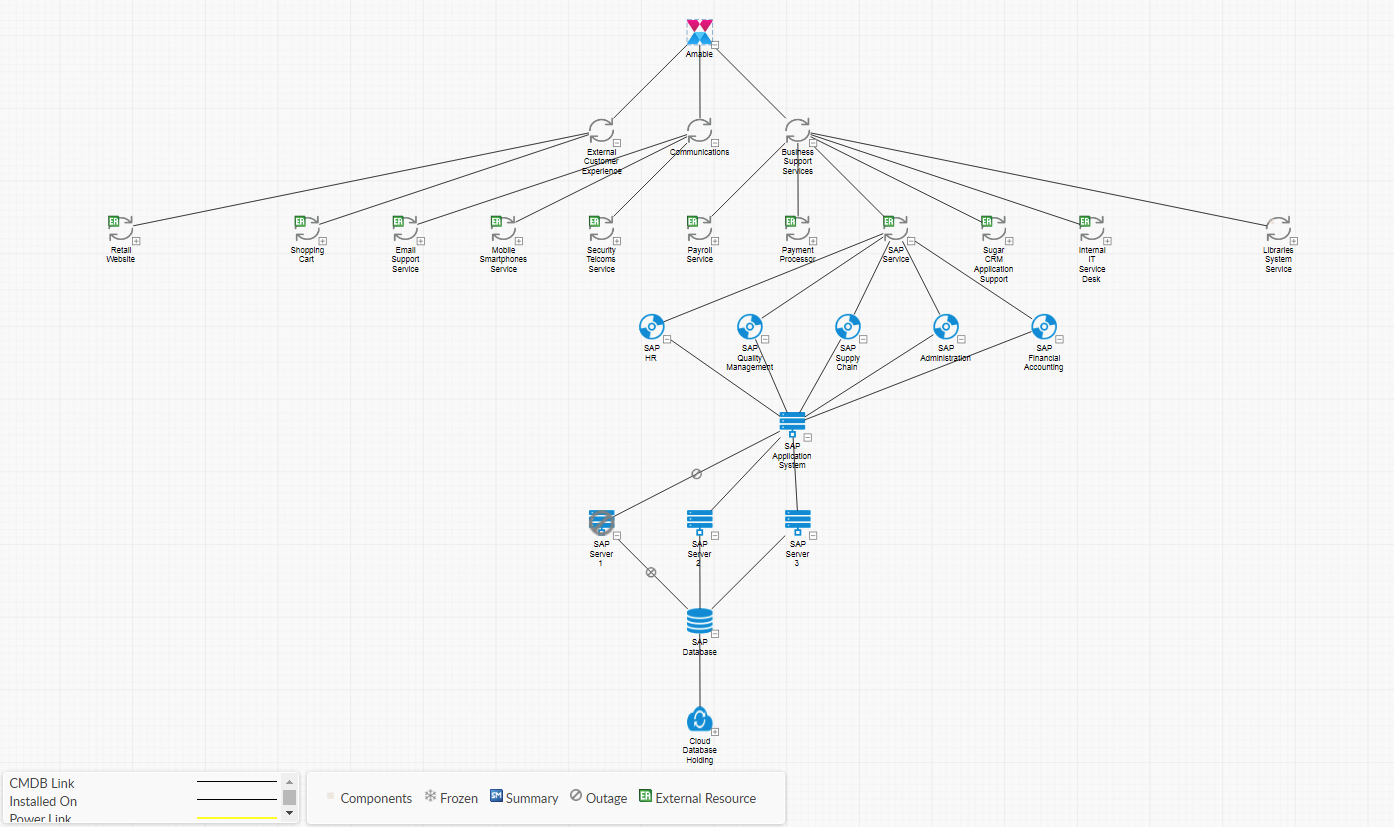
Only the CMDB items linked through the Linked Items tab in the CMDB Item Details window appear on the linking diagram. Items linked through an extension field that has been added to the CMDB Item Details window in ASM Designer will not appear.
Uses for the Linking Diagram
There is a range of scenarios in which the linking diagram can be used to plan and project manage. Here are a few:
You want to carry out an upgrade to a server. You can simulate an outage on the Linking Diagram to visually represent the impact of taking down the server, and can contact those impacted to arrange a suitable time for the outage.
A User calls the service desk to report that their SAP system is not working. You can use the Linking Diagram to see if there are any current outages that may be causing the issue. If not, you can use the Find Causes feature to visually track where the problem may be originating, or to perform more formal Fault Tree Analysis.
As part of a Continuous Service Improvement program, you want to perform Component Failure Impact Analysis to identify critical CIs and fragile services, with multiple single points of failure (SPOFs). The linking diagram shows you all you need to know regarding inter-CI impact and alternative CIs to complete the CFIA grid.
A Project Manager wants to view all of the related projects and Programs.
Viewing the Linking Diagram
Before you start
Enable Full Expand should be selected in the CMDB Settings in order to use the Full Expand option in the Linking Diagram.
Display the linking diagram in either of the following ways:
Search for the CMDB item. When the results are displayed in the browse table, select the item and then select the Action icon from the toolbar.
Select the Linking explorer option from the <Entity> Details window.
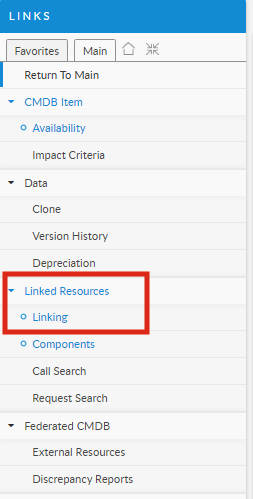
This is only available if the item is linked to other items. The Text will appear in Blue, if there are links. The linking diagram appears.
Container-component links are not displayed on the linking diagram. Components can be viewed through the Components explorer option or by right-clicking on a container item.
Summarized links are displayed on the Summarized tab in the Information panel.
With the linking diagram on screen, you can do any of the following:
Move around the diagram
Select white space and drag to move the linking diagram around the window
Show or hide the captions
Select to show or hide the captions on the linking diagram.
View the links between items
Double-click a link line in the linking diagram.
If the link is a single parent-child or peer-peer link, the Link Details popup window appears.
If the link has multiple links, the links are listed, allowing you to select the one whose details you wish to view and select Open to view the Link Details.
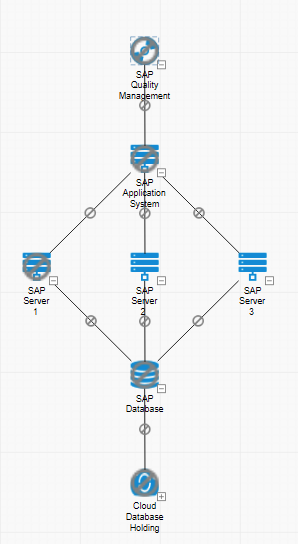
The following table shows the arrow types used and what they denote, where A and B represent different items:
Your administrator may have defined link types. In this case, the lines between the linked CMDB items may be different sizes or colors depending on the types of links between them. There may also be captions along the lines describing the links. The legend beneath the linking diagram will explain the different link types and icons. You can show or hide the legend in the filter options.
View the linked items
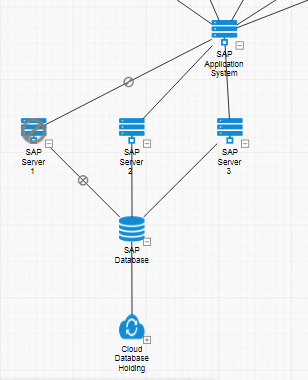
View the linked items on the linking diagram. Each CMDB item has a plus or a minus symbol next to it. Select the plus symbol to show all other CMDB items linked to it – both at a higher (parent) level and at a lower (child) level. Select the minus symbol to hide the linked CMDB items that are linked at the lower level; the parents will still be displayed.
The legend at the bottom of the diagram explains any icons attached to the item(s).
The level of depth of links displayed is set by the Range option found in the Filter menu.
View an item in more detail
Double click on an item to view the details or right-click on it and select Select Item from the menu.
You can also view further information on the information panel.
View component items
Right-click on a CMDB item and select Show Components to view the information about components in the Info tab in the Information Panel. Alternatively, select the Components Explorer option.
This is only available if the selected CMDB item has component CMDB items.
Print the diagram
Right-click on a CMDB item and select Print to print the Linking Diagram.
Copy the diagram
Right-click on a CMDB item and select Copy Chart to copy the Linking Diagram to the clipboard as a bitmap file.
Expand and view links
Right-click on a CMDB item and select Full Expand to expand and view links for the selected item.
This option is only visible if Enable Full Expand is selected on the CMDB Settings window
You should be aware that selecting Full Expand can have performance implications for large CMDBs.
View external resources
Right-click on a CMDB item and select Show External Resource to display details of any external resources linked to the CMDB item. Alternatively, select the External Resources Explorer option.
This is only available if there are linked external resources. You can see the Ext. Resource icon if there are associated external resources and the option to display the icon is selected in the Filter menu.
You may also want to filter the information displayed, find the cause of an outage or simulate an outage.
You can also select from a range of Explorer options to carry out further tasks.
Filtering the Linking Diagram
To filter the items included in the linking diagram, select Filters in the top left hand corner of the linking diagram to see the drop down filter menu. Then select your filter options as follows.
Relationship Profiling
097b075356664ea7bd7095bafc1d5719
Display
19d17a1454124f2ca4ec9eb4d7115da6
Link Types
Select the Link Types that you want to display on the linking diagram.
The link types available include all link types that have been created on your system, including link types which have been deleted. This is because some items in the CMDB linking diagram may still use deleted link types.
If you increase the number of levels displayed in the linking diagram, the additional levels will only be displayed if you have not expanded the node for any CMDB Items in the diagram. When you expand a node, and then close it, only the child nodes close, the parent node remains open, and is therefore not refreshed when the number of levels to be displayed is changed.
Select Ok to refresh the linking diagram and close the Filter menu. Select Reset to revert to the default system settings for the linking diagram.
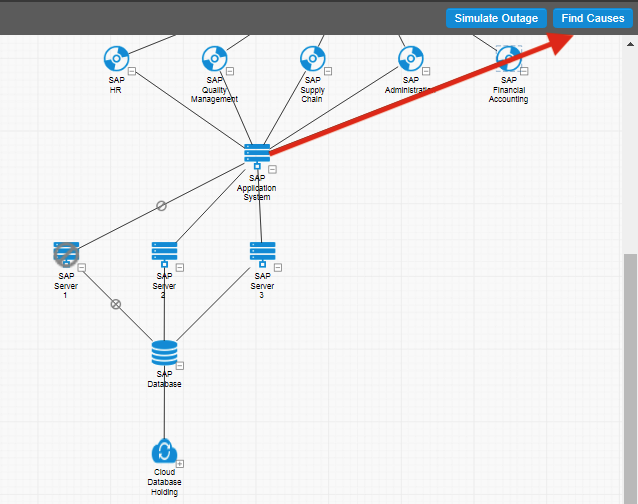
Finding the Cause of an Outage on the Linking Diagram
The linking diagram displays any outages on linked CMDB items that may be causing the outage on the selected CMDB item. The number of levels displayed depends on the value selected for the Range drop-down.
The Find Causes button on the linking diagram displays the potential causes for an outage on a selected CMDB item.
The ‘find cause’ analysis does not pick up deleted links or linked items.
Display the linking diagram
Select a CMDB item on the linking diagram for which you wish to view the outage cause analysis.
Select Find Causes in the top right corner of the diagram.
The linking diagram is redisplayed with circles through the affected items, and a Potential Causes Analysis panel appears below the Info tab. This panel displays services and configuration items that may have caused the outage on the selected CMDB item.
Select Find Causes to end the cause analysis and return to the linking diagram.
Simulating an Outage on the Linking Diagram
You can simulate an outage against a selected CMDB item, to assess the impact of different “what-if” scenarios. The Simulate Outage functionality also takes into consideration any existing outages on linked items.
Display the linking diagram
Select a CMDB item on the linking diagram for which you wish to view the impact of an outage.
Select Simulate Outage in the top right hand corner of the linking diagram.
The number of levels that are displayed in the diagram can be set using the filter options. The default number of levels displayed in the CMDB linking diagram is 1.
The diagram is redisplayed with only the affected items, shown with circles indicating that they would be adversely affected. The Info tab in the Information panel displays a Full Impact Analysis section which lists the services and configuration items impacted by the outage on the selected CMDB item.
To return to the linking diagram, select End Simulation in the top right hand corner of the linking diagram.
The Information Panel on the Linking Diagram
The information panel to the right of the linking diagram displays information for CMDB item or link type currently selected on the diagram. If you are conducting a simulated outage, the full impact analysis is also displayed.
The information panel has the following tabs:
Info
Displays information about the CMDB item currently selected on the linking diagram, such as its title, status, and creation date.
Stakeholders
Displays a list of the stakeholders linked to the currently selected CMDB item. This tab is disabled if you select a link type.
Impact
Displays the linked CMDB items and other CMDB entities (such as people, organizations, and agreements) that are impacted by the currently selected CMDB item. This tab is disabled if you select a link type.
Summarized
Displays a list of CMDB items that are linked to the currently selected CMDB item by the Summary CMDB link type.
The Info Tab
The Info tab on the linking diagram Information Panel displays information about the item or link currently selected on the linking diagram. These details will depend on the type of CMDB item or type of link.
A selected CMDB item can be identified on the diagram as the image has a visible border and the item name is highlighted. If you select a link, the name of the link is shown at the top of the Information Panel.
For an item, the following information appears.
Title
Status
Criticality
Availability Tracked
Org
Location
User
Service Level
Version
Class
CMDB Item Type
Last Checked (Date)
Last Updated (Date)
Created (Date)
Partition
The following information appears for a selected link.
Link Name
Category
CMDB Item A
Role A
CMDB Item B
Role B
A Impacts B
B Impacts A
The Stakeholders Tab
The Stakeholders tab on the linking diagram Information Panel displays information about all stakeholders that are defined for the CMDB item currently selected in the linking diagram.
Each section in this tab has a heading that defines the stakeholder type, that is, Person, Organization, IPK Group, or Workflow Group. The heading shows the icon that represents the stakeholder type.
To show or hide the linked items for each section, simply select the + or – icons in front of the item type. Vertical and horizontal scroll bars will appear when required to view the complete data set.
The Impact Tab
The Impact tab on the linking diagram Information Panel displays all linked CMDB entities that are dependent on the selected CMDB item. This applies to any CMDB item selected on the linking diagram, including a service, service action, service bundle, or configuration item.
The information in the Impact tab is the same information that appears in the Impact Search window, accessed by selecting Impact from the drop-down menu on a CMDB item Q/D field.
The tab includes a tree with nodes for all the CMDB items that have been linked to the selected CMDB item. Agreements and Locations are shown if you are viewing a service item.
To show or hide the linked items for each node, simply select the + or – icons in front of the item type. Vertical and horizontal scroll bars will appear when required to view the complete data set.
The Summarized Tab
The Summarized tab on the linking diagram Information Panel shows CMDB items that are linked to the selected item by a Summary CMDB link type.
Select an item that is linked to another by a Summary link. Depending on the selections made in the Filter menu, the icon will be shown next to the item. (The tab is unavailable if you select a link type or a CMDB item that is not linked to other items using a Summary link.)
On the information panel, select the Summarized tab.
The tab lists the items linked by a summary link, and you can select any of them to view the details.
Use to scroll left and right in the information panel to view the different tabs.