8.4 Average Time to Respond

Beginning with ASM Version 10, embedded Dashboarding and Reporting functionality was provided through the Syncfusion Dashboard Platform. Alemba used the latest version of the Syncfusion Dashboard Platform v4.1.0.84 under a Global Embedded License with Syncfusion. Support for this platform ended December 2024.

From September 2022, the Syncfusion Dashboard Platform entered the Extended Support phase of its product lifecycle until the end of September 2024. As Alemba is a Premium Support partner with Syncfusion, this was extended until the end of December 2024.

As of December 2024 (10.6.8.15038), ASM Supports connections to Bold BI natively for Analytics.

Dashboard Name

Average time to respond

Availability

ASM All Version

Type

SQL

Categorisation

SDI

Available Parameters

Channel, Logged Date, IPK Status, Target

Description

The service desk routinely and consistently collects and analyses the average time it takes to acknowledge and respond to an incident or service request by channel or method (i.e. phone, e-mail, self-logging, live chat,SMS, social media).

Requirements / Considerations / Specification / Configuration

Type

Information

Requirement

IPK statuses to separate Incidents and Service Requests, this does not cover workflow driven requests as part of Request Fulfilment

Config

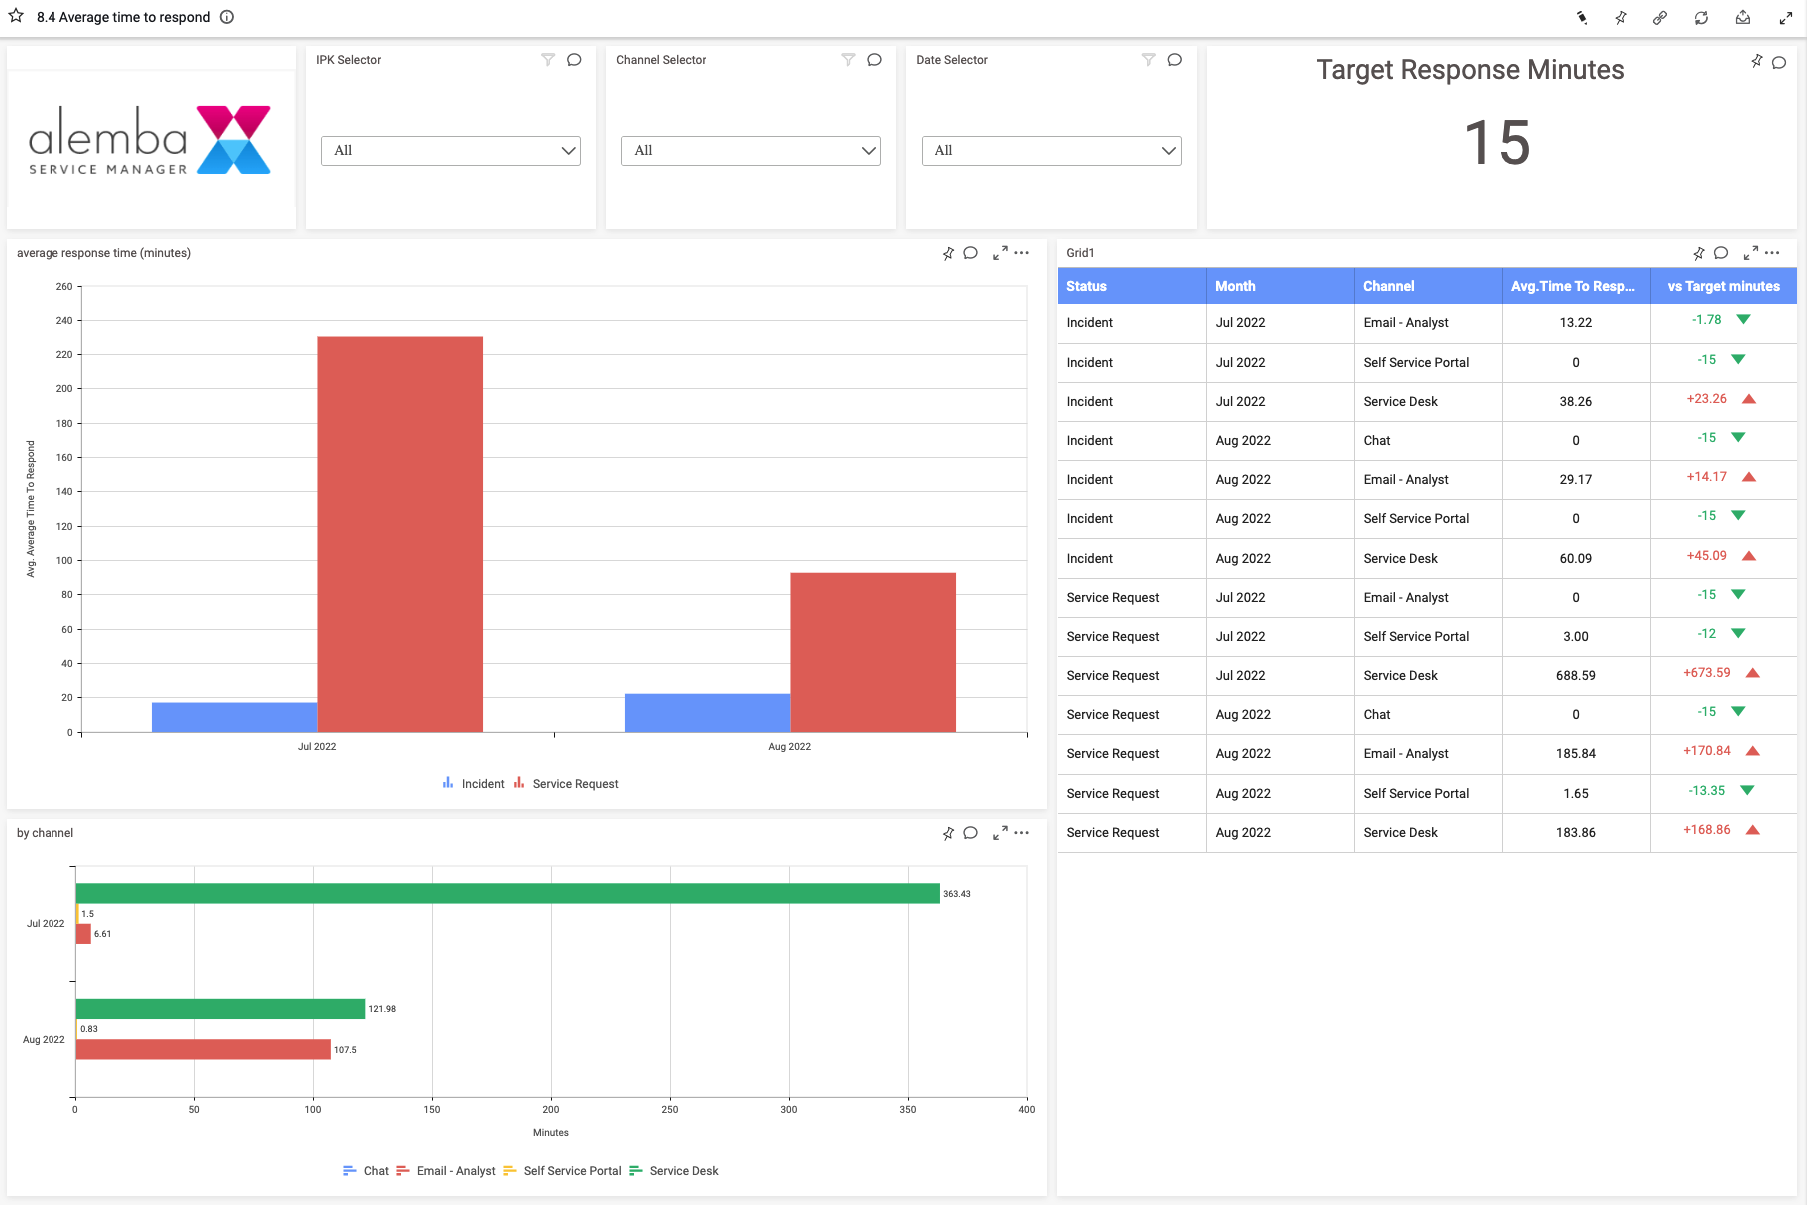
The target value can be set on a per customer basis by altering the ‘Target’ expression stored against the datasource in the Dashboard. This is set to 15 minutes by default. SLA’s need to be configured utilising the First call back option as the calculation is using elapsed time against this event

Spec

A full 13 month of data (excluding the current month) is reportable across the two graphs 1. Average response time(minutes) split by IPK 2. By channel. A grid displays the results by IPK, month,average time to respond and a comparison against target.

Screenshots

Chart, Excel, waterfall chart Description automatically generated

Last updated

Was this helpful?